Innovation Intelligence at APSX
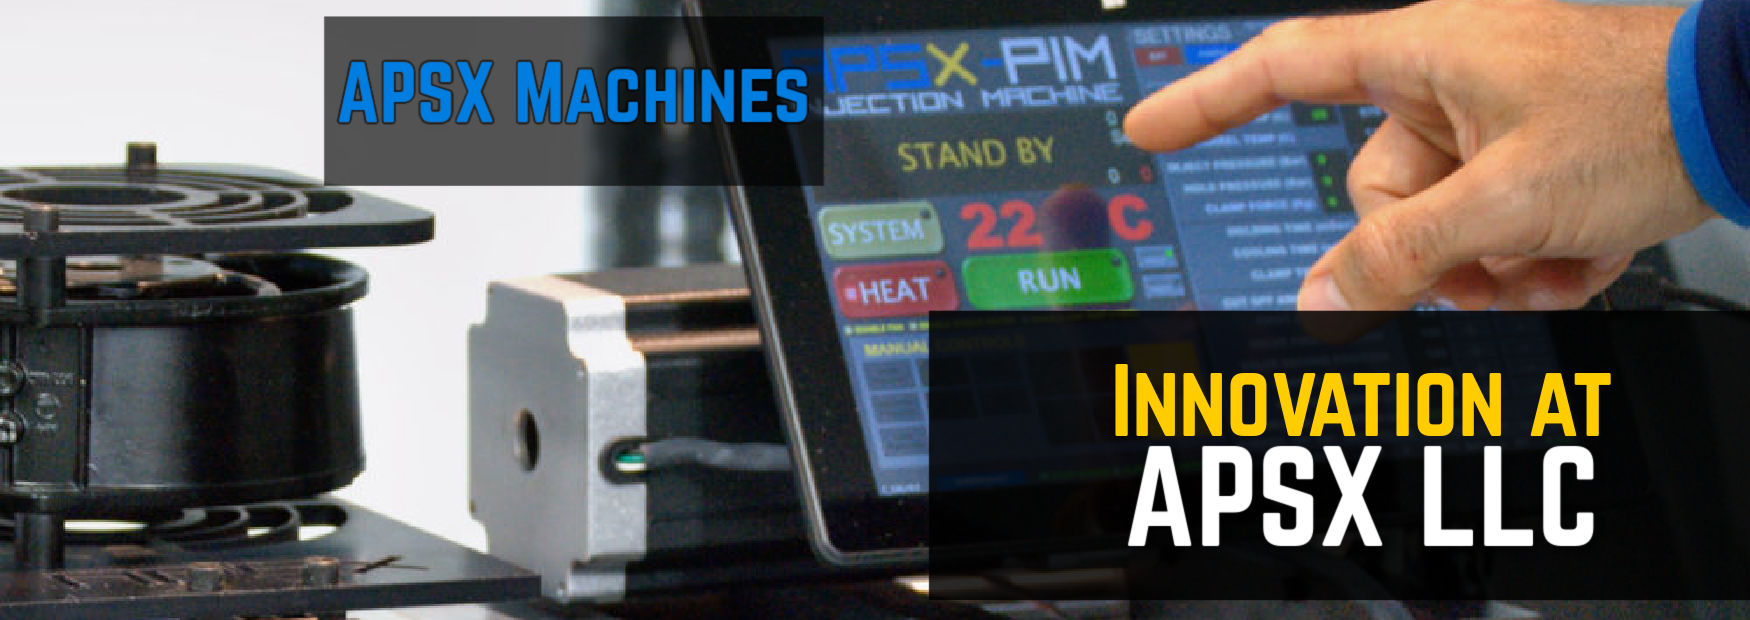
Innovation Intelligence at APSX Machines
APSX machines incorporate data and visualization capability, including to chart injection volume versus injection pressure for each cycle. The goals here is to enhance precision, efficiency and ease of use.
It uses its own machine data to monitor and optimize the injection molding process, which would include the ability to track and visualize injection pressure and volume. The APSX-PIM uses electric motors that support detailed process monitoring and optimization. The ultimate purspose is to deliver consistent quality and operational efficiency.
The Chart Feature with the APSX-PIM V3
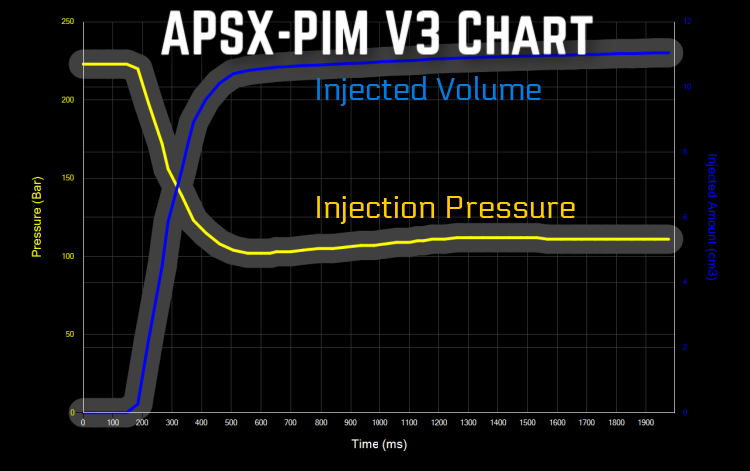
The chart feature that shows injection volume vs. injection pressure for each injection cycle on an injection molding machine is an important tool for monitoring and optimizing the molding process. Here’s how it works and what it indicates:
Functionality:
- Injection Volume: This refers to the amount of melted plastic that is injected into the mold during a single cycle. It is usually measured in cubic centimeters (cc) or grams.
- Injection Pressure: This is the pressure applied to push the melted plastic into the mold. It's typically measured in bars or pounds per square inch (PSI).
Chart Description:
- X-Axis: Represents the injection time in miliseconds. As you move right, the volume of plastic injected increases then saturates.
- Y-Axis: Represents the injection pressure and also the injected volume. Higher values on this axis indicate higher pressures and volumes.
Purpose and Analysis:
- Visual Insight: The chart provides a visual representation of the relationship between how much plastic is being injected and at what pressure this occurs over each cycle.
- Cycle Consistency: By examining the chart, technicians can identify any variability in injection pressure for a given volume of plastic across cycles. Consistent data points suggest stable and predictable processing conditions.
- Optimization: It helps in identifying the optimal injection pressure for a given volume of plastic to ensure complete and uniform filling of the mold without causing damage to the machine or the product due to excessive pressure.
- Troubleshooting: Deviations from the norm can indicate issues such as blockages, leaks, or problems with the plastic's viscosity, enabling timely troubleshooting and adjustments.
Usage:
- Quality Control: Regular analysis of these charts helps in maintaining the quality of the manufactured parts by ensuring the process stays within specified parameters.
- Process Adjustment: Operators can use this data to adjust processing parameters like changing pressure or correcting material feed rates to achieve better results in terms of quality and efficiency.
This chart is a critical tool for ensuring the efficient and effective operation of injection molding machines, allowing operators to fine-tune the process based on real-time data.